Claude Code "Error: Reached max turns (1)": when the headless guardrail fires, your file may already be written
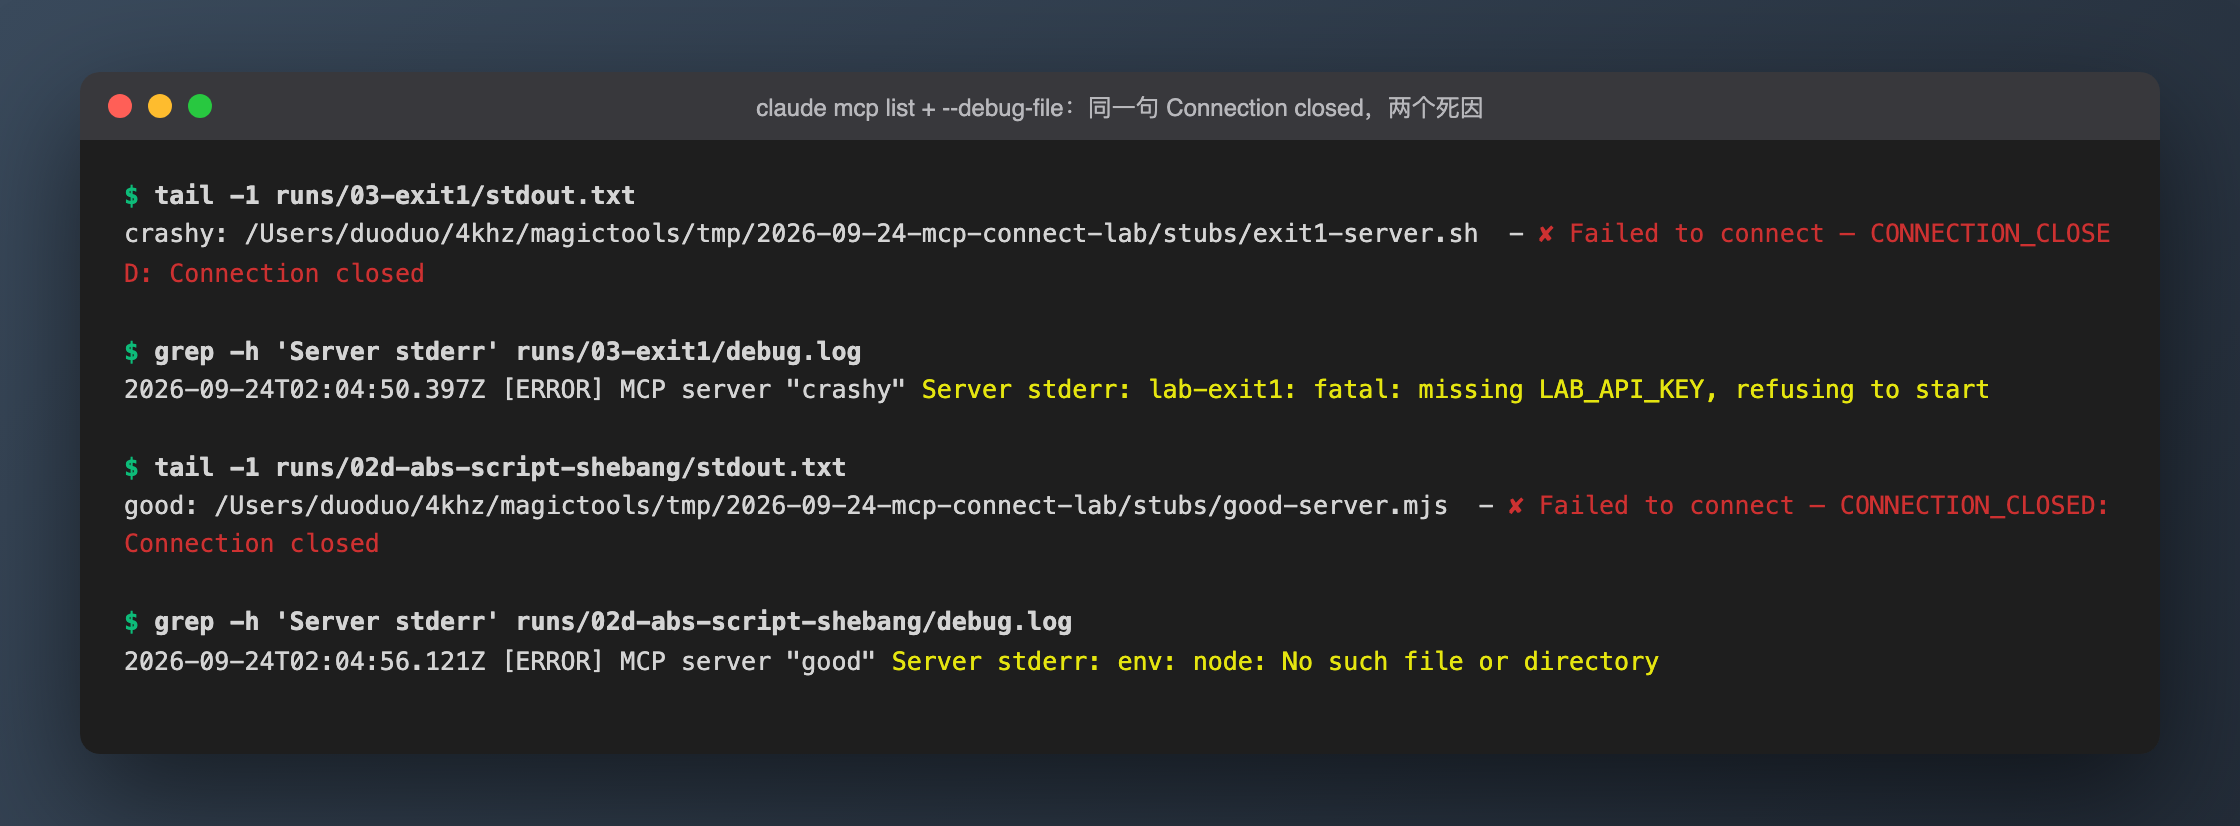
This is part 3 of the Claude Code error-message series. Part 1 was "auto mode temporarily unavailable" and part 2 was MCP "Failed to connect". This one covers a new pair of errors, from the two guardrails in headless mode (claude -p):
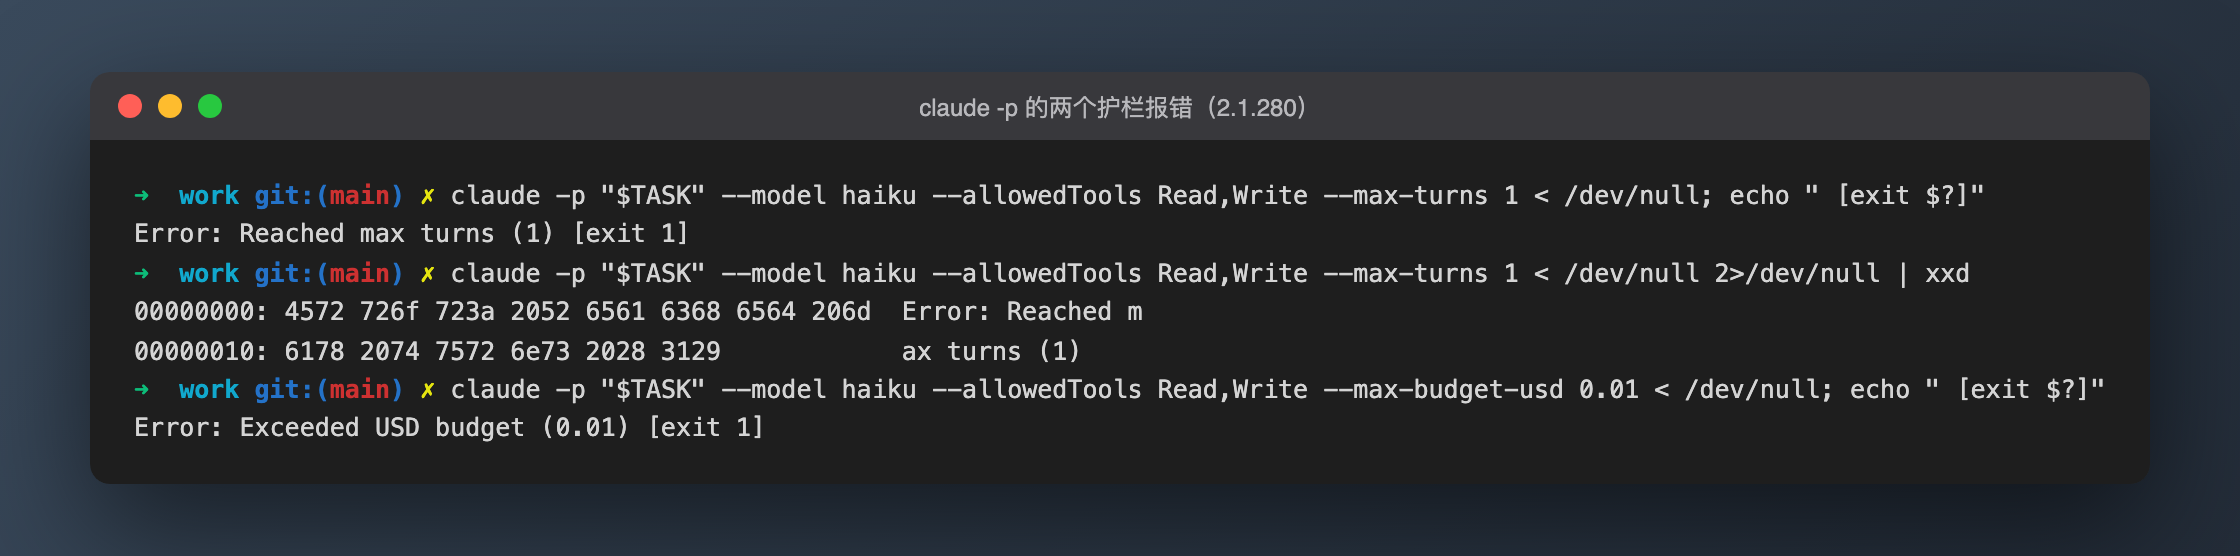
Error: Reached max turns (1)
Error: Exceeded USD budget (0.01)
With --output-format json you don't get those lines at all. Instead you get "subtype": "error_max_turns", "terminal_reason": "max_turns", and a result field that doesn't exist.
Background
If you run Claude Code in CI, cron or a batch script, you normally put limits on it:
--max-turns Ncaps how many turns it takes, so the model can't loop on tool calls forever.--max-budget-usd Xcaps what it spends, so one job can't run up a large bill.
The official CLI reference (fetched 2026-09-25) gives each flag one sentence:
--max-turns: "Limit the number of agentic turns (print mode only). Exits with an error when the limit is reached. No limit by default."--max-budget-usd: "Maximum dollar amount to spend on API calls before stopping (print mode only)."
That leaves out what a script author actually needs to know:
- Which stream does the error go to?
- What exit code do you get?
- What does the json look like?
- Does work the model already did still count when it gets cut off?
- What exactly does "1 turn" count?
I measured all of it.
Analysis
Every run used the same three-step task:
- Read the number on line 3 of
data.txt(42). - Write that number times 2 into
out.txt. - Reply with the final number.
When it succeeds, out.txt contains 84. The task needs at least 3 model calls (Read → Write → reply), so it's easy to see what happens when the cut lands at each point.
Here's the short version. These guardrails behave in four ways you might not expect:
- The error goes to stdout, not stderr.
2>/dev/nullwon't hide it. It also has no trailing newline, so it runs into the next line of your log. - In json mode there is no
resultkey.jq -r .resultprints the four lettersnull, and jq itself exits 0. A downstream script will pass the string"null"along as if it were the model's answer. This is the least visible way these errors can break a pipeline. - A failure doesn't mean nothing happened. Tool calls issued on the Nth model call still run. When
--max-turns 2fires, the file has already been written. - The budget is checked after the fact. Claude Code compares total spend only after an API call returns, so it can go over the cap by up to one call. That last call may have finished the job, and you still get exit 1.
Also: --max-turns does not appear in claude --help on 2.1.280, even though the docs list it. --max-budget-usd does appear, marked "only works with --print".
Options and choice
A downstream script can decide whether a claude -p run succeeded in several ways:
| Approach | Verdict | Why |
|---|---|---|
| Check the exit code only | Use it (enough for pass/fail) | Across 22 json runs over two days, claude exit 1 matched a FAIL verdict every time |
--output-format json + check is_error and subtype |
Use it (when you need the reason) | terminal_reason tells max_turns, budget_exhausted and api_error apart |
Grep text-mode stdout for Error: |
Rejected | The error shares a stream with normal answers, has no newline, and a normal answer can contain Error: |
Take jq -r .result and test for empty |
Rejected | On failure it prints a literal null with jq exit 0, so [ -n "$r" ] is still true |
Check subtype only |
Rejected | On a gateway 503, subtype is success while is_error is true (see below) |
Rely on --max-turns in interactive mode |
Rejected | Interactive mode ignores the flag (tested once, E6) |
--resume after a cut to save money |
Not a saving | On 09-25 resuming cost about 32% more than a fresh run; on 09-23 the two were even |
This is the judge script I ended up with. I ran it over all 22 json runs from both days, and its verdict matched claude's exit code every time:
#!/bin/bash
f="$1"
if ! jq -e . "$f" >/dev/null 2>&1; then echo "FAIL no-json"; exit 1; fi
read -r is_error subtype reason < <(jq -r '[(.is_error|tostring), (.subtype // "none"), (.terminal_reason // "none")] | @tsv' "$f")
if [ "$is_error" = "false" ] && [ "$subtype" = "success" ]; then
  echo "OK   $(jq -r '.result' "$f")"; exit 0
fi
echo "FAIL subtype=$subtype terminal_reason=$reason errors=$(jq -c '.errors // .result' "$f")"; exit 1
The exit code can't tell you two things, so you need something else for them:
- Why it failed: read
terminal_reason. - What already changed on disk: check your outputs and any temp files yourself (see Results).
How it was tested
- Environment: macOS on a Mac mini M4. Every
claude -punder test used--model haiku(Haiku 4.5) and--allowedTools Read,Write. - Isolation: each run got its own
CLAUDE_CONFIG_DIRand< /dev/null, plus--debug-fileso I could count the real/v1/messagesrequests one by one. - Two sessions, two versions:
- 2026-09-23 on Claude Code 2.1.270: the first round.
- 2026-09-25 on 2.1.280: I read the 09-23 raw logs back, then re-ran the key groups.
- Costs: every cost in this article is the CLI list price (
total_cost_usd, or[engine] cost=in the debug log), not an actual bill.
The version drift is itself a reading. One version later, the error bytes, the fields, the meaning of N and the cost steps were all unchanged. Every table row below is labeled with its collection date.
Repro commands ($TASK is the three-step prompt above):
claude -p "$TASK" --model haiku --allowedTools Read,Write --max-turns 1 < /dev/null; echo " [exit $?]"
claude -p "$TASK" --model haiku --allowedTools Read,Write --max-turns 1 < /dev/null 2>/dev/null | xxd
claude -p "$TASK" --model haiku --allowedTools Read,Write --max-turns 1 --output-format json < /dev/null | jq -r .result
claude -p "$TASK" --model haiku --allowedTools Read,Write --max-budget-usd 0.01 < /dev/null; echo " [exit $?]"
Results
Exact error text and byte shape
| Date / version | Mode | Output | Bytes | Stream | exit |
|---|---|---|---|---|---|
| 09-23 / 2.1.270 | text, --max-turns 1 |
Error: Reached max turns (1) |
28, no newline | stdout | 1 |
| 09-25 / 2.1.280 | text, --max-turns 1 |
Error: Reached max turns (1) |
28, no newline, stderr 0 bytes | stdout | 1 |
| 09-25 / 2.1.280 | text, --max-budget-usd 0.01 |
Error: Exceeded USD budget (0.01) |
33, no newline, stderr 0 bytes | stdout | 1 |
| 09-25 / 2.1.280 | json, --max-turns 1 |
subtype: error_max_turns, terminal_reason: max_turns, errors: ["Reached maximum number of turns (1)"], no result key |
- | stdout | 1 |
| 09-25 / 2.1.280 | json, --max-budget-usd 0.01 |
subtype: error_max_budget_usd, terminal_reason: budget_exhausted, errors: ["Reached maximum budget ($0.01)"], no result key |
- | stdout | 1 |
The two modes word it differently. Text mode says Reached max turns; the json errors array says Reached maximum number of turns. If you grep for the string, match both.
On a run that was cut off, jq -r .result prints null (xxd: 6e75 6c6c 0a) and jq exits 0. With jq -e -r .result, jq exits 1. jq -r 'has("result")' prints false: the key isn't there at all. It isn't a key whose value is null.
What --max-turns N actually counts
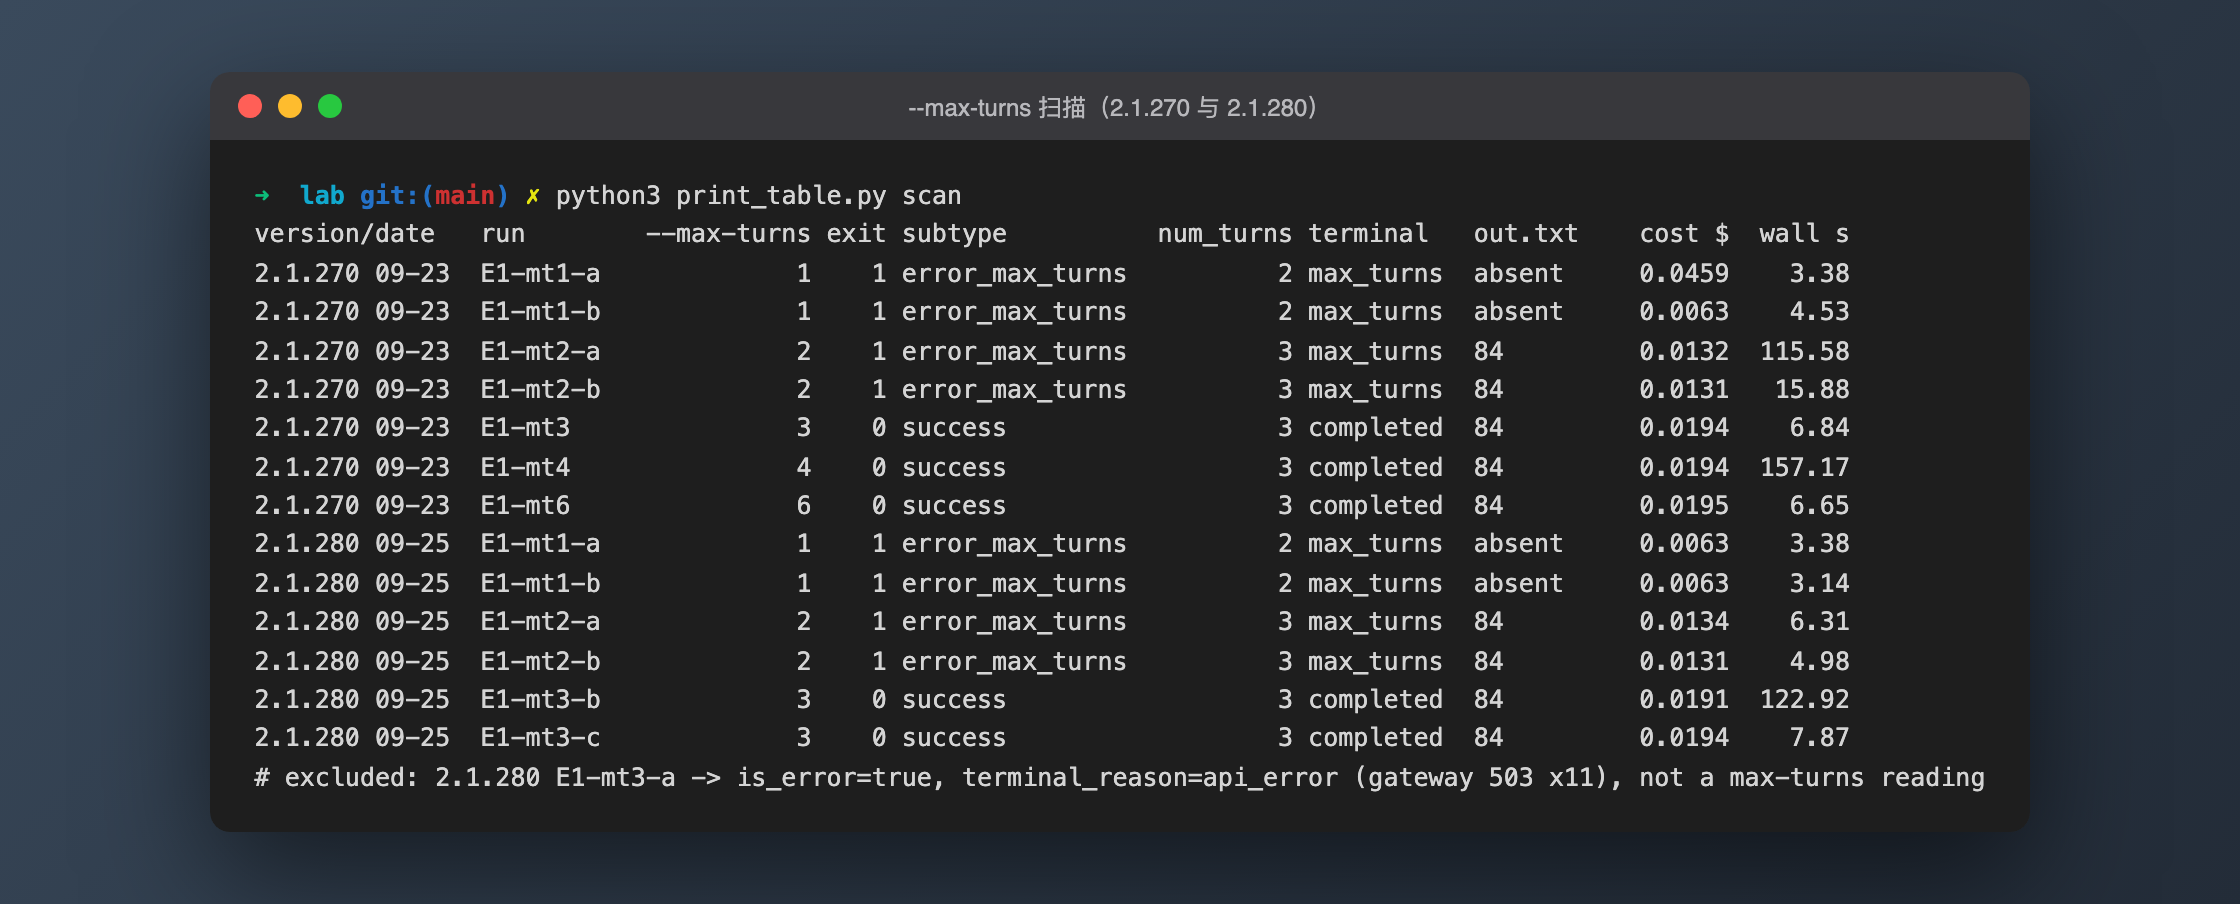
| Date / version | --max-turns | exit | subtype | num_turns | Model calls | out.txt | Cost $ |
|---|---|---|---|---|---|---|---|
| 09-23 / 2.1.270 | 1 | 1 | error_max_turns | 2 | - | none | 0.0459 / 0.0063 |
| 09-23 / 2.1.270 | 2 | 1 | error_max_turns | 3 | - | 84 | 0.0132 / 0.0131 |
| 09-23 / 2.1.270 | 3 | 0 | success | 3 | - | 84 | 0.0194 |
| 09-23 / 2.1.270 | 4 | 0 | success | 3 | - | 84 | 0.0194 |
| 09-23 / 2.1.270 | 6 | 0 | success | 3 | - | 84 | 0.0195 |
| 09-25 / 2.1.280 | 1 | 1 | error_max_turns | 2 | 1 | none | 0.0063 / 0.0063 |
| 09-25 / 2.1.280 | 2 | 1 | error_max_turns | 3 | 2 | 84 | 0.0134 / 0.0131 |
| 09-25 / 2.1.280 | 3 | 0 | success | 3 | 3 | 84 | 0.0191 / 0.0194 |
(The 09-23 runs had no --debug-file, so there are no per-request counts for them. The 09-25 call counts come from the [API REQUEST] /v1/messages lines in each debug log.)
What the numbers show:
- N is the number of model calls allowed. mt1 made exactly 1 request, mt2 exactly 2, mt3 exactly 3.
- When cut off,
num_turnsreports N+1. On success it reports the real call count. If you usenum_turnsto answer "how many turns ran", you'll be off by one. - Tool calls issued on the Nth call still execute. In mt2 the second call issues a Write. The file is written atomically (
out.txt= 84), and only then does the run reporterror_max_turnsand exit 1. A script that "rolls back" based on the exit code alone will assume nothing happened. - The cost steps are almost the same on both versions: about $0.0063 / $0.013 / $0.019 with a warm cache.
Resuming after a cut
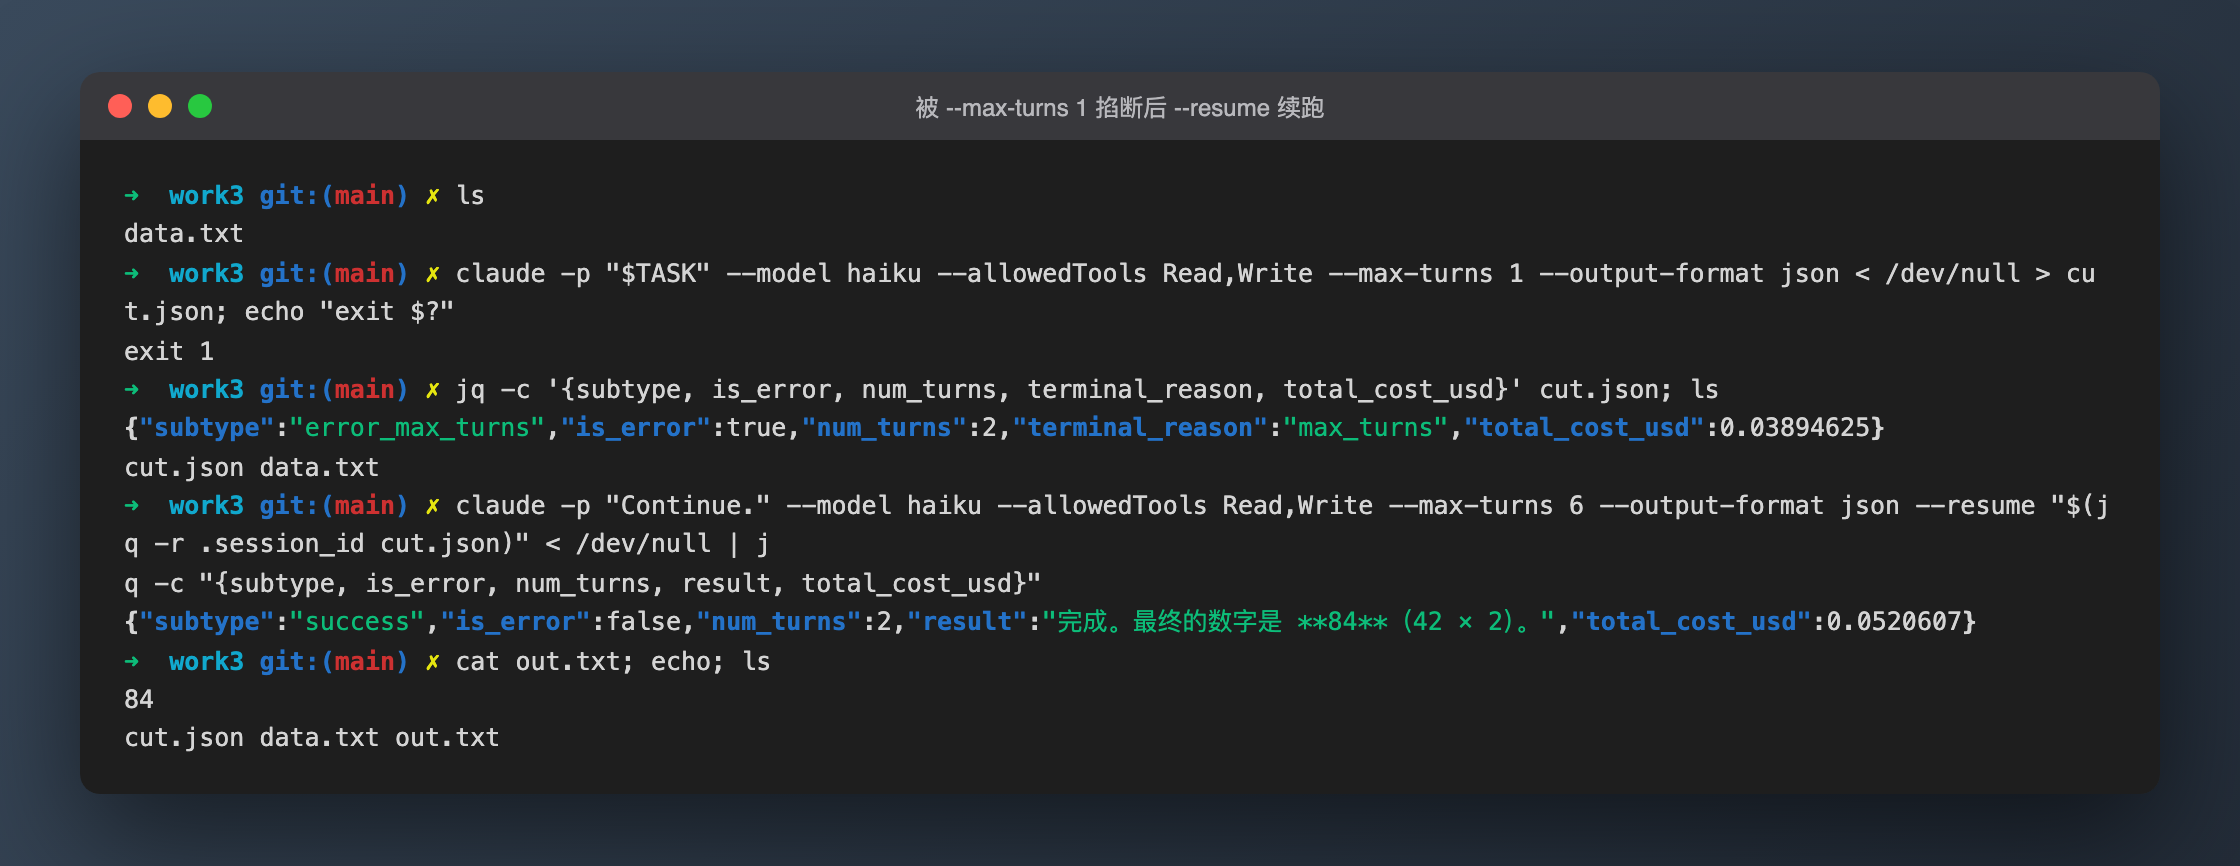
Resuming the cut session with --resume <session_id> and the prompt Continue. finishes the job. The model only issued the Write, since the Read result was already in the conversation. It isn't cheaper, though:
| Date / version | Cut | Resume | Total | Fresh full run |
|---|---|---|---|---|
| 09-23 / 2.1.270 | $0.0063 | $0.0132 | $0.0195 | $0.0194 |
| 09-25 / 2.1.280 | $0.0063 | $0.0193 | $0.0256 | $0.0194 (about 32% more) |
| 09-25 / 2.1.280 (screenshot run, new dir, cold cache) | $0.0389 | $0.0521 | $0.0910 | - |
The two days disagree (even once, 32% more once). The honest conclusion is "resuming doesn't save money", not "resuming always costs more".
--max-budget-usd is checked after each call
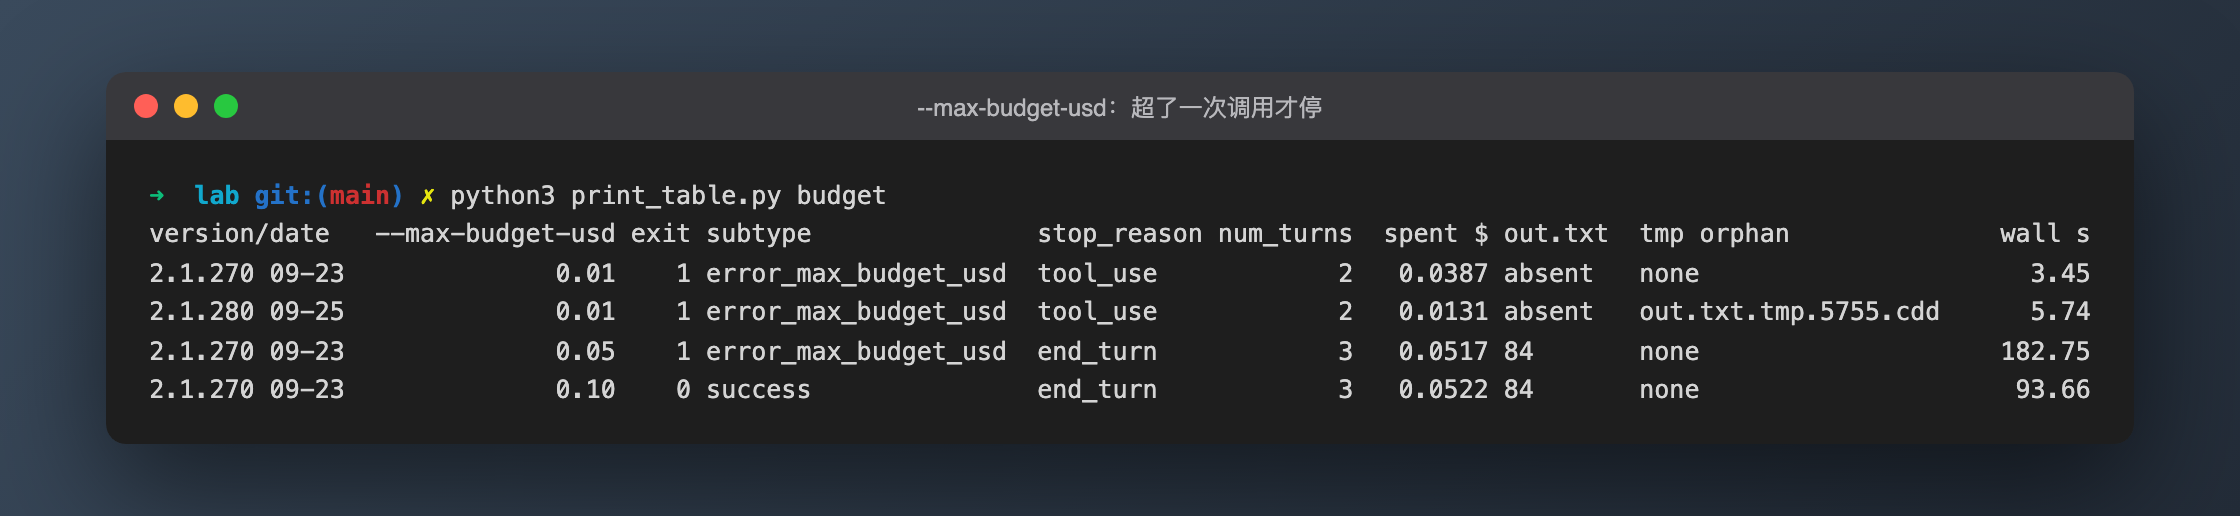
| Date / version | --max-budget-usd | exit | subtype | stop_reason | Spent $ | out.txt | Leftover temp file |
|---|---|---|---|---|---|---|---|
| 09-23 / 2.1.270 | 0.01 | 1 | error_max_budget_usd | tool_use | 0.0387 | none | none |
| 09-25 / 2.1.280 | 0.01 | 1 | error_max_budget_usd | tool_use | 0.0131 | none | out.txt.tmp.5755.cddea0807d29 (2 bytes, 84) |
| 09-23 / 2.1.270 | 0.05 | 1 | error_max_budget_usd | end_turn | 0.0517 | 84 | none |
| 09-23 / 2.1.270 | 0.10 | 0 | success | end_turn | 0.0522 | 84 | none |
(The 0.05 and 0.10 caps only have 09-23 data. They weren't re-run on 09-25.)
The 0.05 cap shows the problem most clearly:
- The top-level
usagecovers only the first two calls. At list price they come to $0.0454, under the cap, so a third call is allowed. - By the time the third call returns, the model has given its final answer (
stop_reason: end_turn) andout.txthas been written. - The total is now $0.0517, over the cap. The run reports
error_max_budget_usd, exits 1, and dropsresult. - The work is done, yet the caller sees a failure.
The "$0.0454 for the first two calls" figure is inferred: it's the modelUsage total minus the top-level usage. That day had no debug log to check call by call.
The 0.01 cap on 09-25 shows a second problem:
- The first call cost about $0.0063, under the cap, so it continued.
- The second call issued a Write; the debug log shows
Writing to temp file ... out.txt.tmp.5755.cddea0807d29. - The total reached $0.0131, over the cap, and the process exited before the rename.
- The working directory was left with a 2-byte
out.txt.tmp.5755.cddea0807d29. The realout.txtdoesn't exist.
The screenshot session the same day did it again, leaving a 0-byte out.txt.tmp.9000.4ffc01d2af2b. That's 2 out of 2. Batch jobs should clean up *.tmp.* and must not assume the leftover is complete.
One more cost reading that goes against intuition:
- On a cold cache,
--max-budget-usd 0.01spent $0.0389 on its very first call (09-25, text mode). That's 6 times a warm--max-turns 1run ($0.0063). - Every run with the budget flag showed about 28k cache-creation tokens and didn't share a cache with the max-turns runs.
- Why is not verified.
Cost roll-up
Json runs only, taken from modelUsage:
| Scope | Runs cut off | Average | Min | Max |
|---|---|---|---|---|
| 09-23 / 2.1.270 | 8 | $0.0235 | $0.0063 | $0.0517 |
| 09-25 / 2.1.280 | 5 | $0.0104 | $0.0063 | $0.0134 |
| Both days | 13 | $0.0185 | $0.0063 | $0.0517 |
On the input side across both days, cache reads were 94.8% and cache creation 5.2%. Uncached input totaled just 396 tokens. So whether the cache is cold or warm drives the cost, not which turn the cut lands on.
The cheapest failure is a warm-cache --max-turns 1 at $0.0063. I measured it twice on each day and got the same number.
Three more readings
Interactive mode ignores --max-turns (verified once). I started claude --max-turns 2 interactively in tmux and gave it the same task:
- The debug log shows 3
repl_main_threadrequests plus 1generate_session_title. - The task ran to completion with
out.txt= 84 and no error on screen. - Cost: $0.0871.
- This matches "print mode only" in the docs.
On a gateway 503, subtype is success. One 09-25 run gave up after 11 consecutive API error (attempt k/11): 503 responses:
- exit 1,
is_error: true,terminal_reason: api_error, butsubtypewassuccess. resultheld the error text:API Error: 503 No available accounts ....- A script that only checks
subtype == "success"would call that a success. That's why the judge script checksis_errortoo.
Slow doesn't mean the guardrail is to blame. On 09-23, --max-turns 4 took 157.17s of wall time while --max-turns 6 took 6.65s:
- Tokens and cost were almost identical.
ttft_mswas 151119, so the delay came before the first token. - 09-25 reproduced the same pattern (ttft 117384; the debug log shows 8 retries on 503 before it succeeded).
- So the 09-23 run was most likely gateway backoff. There's no debug log from that day, so this is inferred.
- The json result doesn't report retry counts, and text mode prints nothing on stderr.
Pitfalls
1. zsh doesn't split unquoted variables, and my loop quietly created directories with spaces in their names. On 09-23 I ran this loop:
for r in "E1-mt2-a 2" "E1-mt2-b 2" "E1-mt3 3" "E1-mt4 4" "E1-mt6 6"; do set -- $r; ./run.sh "$1" --output-format json --max-turns "$2"; done
In bash, set -- $r splits $r into two arguments. zsh doesn't by default: $1 became "E1-mt2-a 2" and $2 was an empty string. The result:
- Five directories such as
runs/E1-mt2-a 2, spaces included. --max-turns ""was accepted without a word, and it meant no limit. All 5 runs exited 0 withsuccessandnum_turns3, and there was no warning.
I moved those 5 runs to _invalid_zsh_nosplit/, and none of them feed any conclusion here. In zsh, the fix is set -- ${=r} or two explicit arrays. set -- on its own doesn't fix anything; it's the part that broke.
The side effect deserves its own note: the guardrail flags don't complain about an empty value. Before your script builds --max-turns "$N", assert that $N isn't empty.
2. The first round was killed by SIGTERM before it wrote up its readings. On 09-23 the outer process ended with exit 143 (stageA.exit = STAGE_A_EXIT=143):
- The raw data in every run directory was complete, but the summary of readings was never written.
- This round, I first read back every run's
stdout,exitcode,walltime_sandside_effect(the directory stayed read-only the whole time), then re-ran the key groups on the newer 2.1.280. - That's why the tables mix two days and two versions, with every row labeled by date.
- Everything from 09-23 reproduced on 09-25: the byte shape, the meaning of N and the cost steps.
- Only a few groups have 09-23 data alone, with no re-run: the 0.05 and 0.10 budget caps,
--max-turns 4/6, and stream-json.
3. Don't forget < /dev/null in headless mode. This is an old member of the same "fails silently" family (see also the hooks stdin trap). Measured on 09-25:
| stdin | Launch to first request | Wall time | stderr |
|---|---|---|---|
< /dev/null |
0.165s | 3.21s | 0 bytes |
| Open pipe, no data | 3.206s (3.205–3.219s over 3 runs) | 6.12s | 157-byte warning |
The warning, as printed to stderr:
Warning: no stdin data received in 3s, proceeding without it. If piping from a slow command, redirect stdin explicitly: < /dev/null to skip, or wait longer.
It doesn't hang forever. It just wastes 3 seconds on every run.
4. CLAUDE_CONFIG_DIR only isolates user-level config. The experiments ran in a tmp/ subdirectory inside the repo, and the interactive trust dialog still reported loading the repo root's .claude/settings.local.json (22 pre-approved tool permissions). For a clean control, run from a directory outside the repo.
For another claude -p lifecycle trap, see No conversation found to continue: a session started with -p can't be picked up by --continue in interactive mode.